Archive for February 11th, 2012
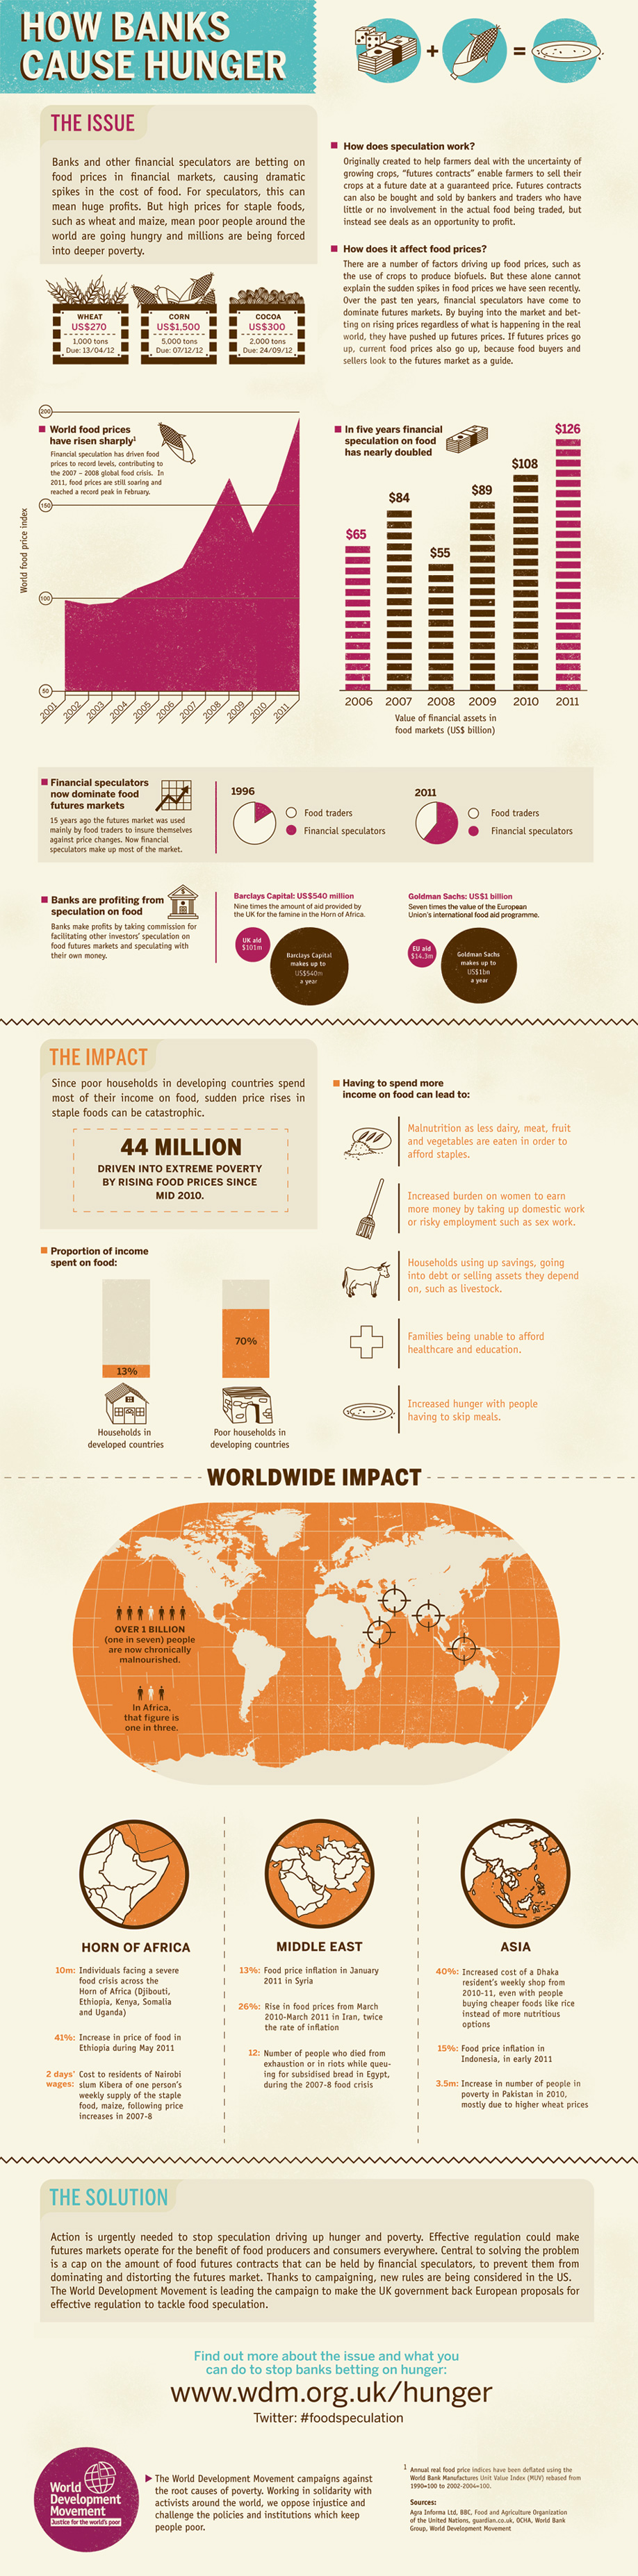
How Banks Cause Hunger
Banks and other financial speculators are betting food prices in financial markets, causing dramatic spikes in the cost of food. This infographic done with the World Development Movement by Columnfivemedia, looks at how higher prices for staple foods, such as wheat and maize, mean poor people around the world are going hungry and millions are being forced into deeper poverty.
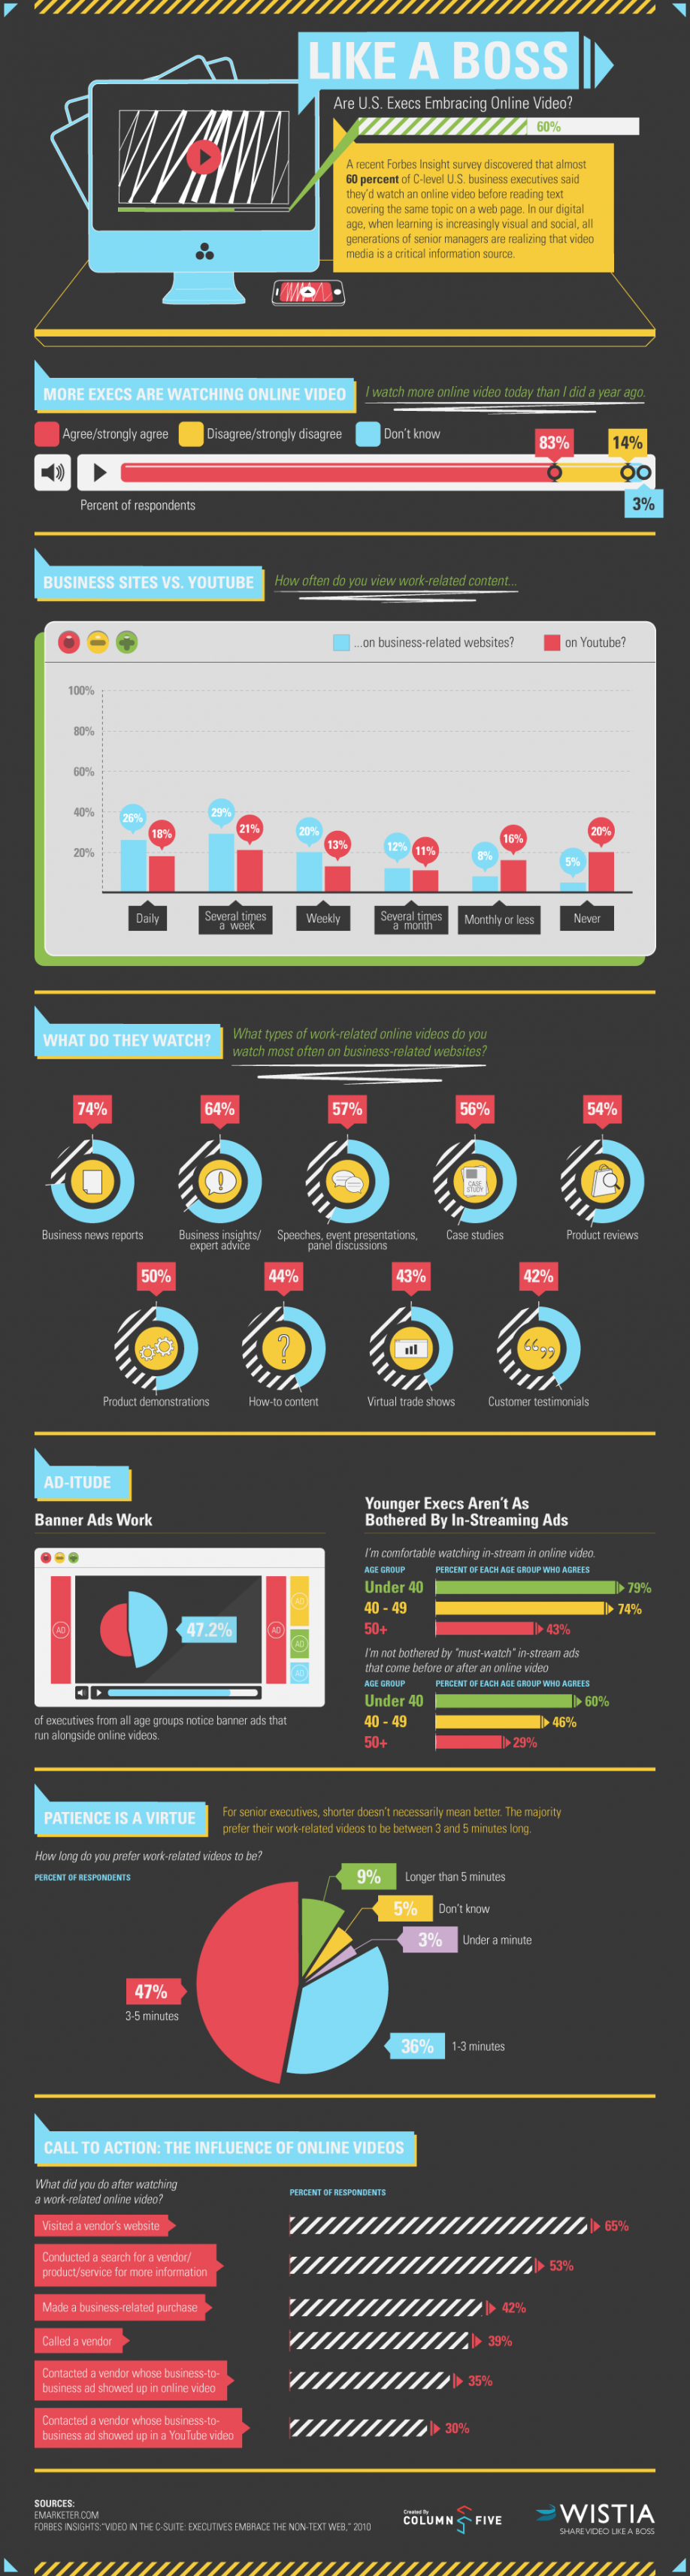
Like a Boss — Are U.S. Execs Embracing Online Video?
A recent Forbes Insight survey discovered that almost 60 percent of C-level U.S. business executives said they’d watch an online video before reading text covering the same topic on a web page. Columnfivemedia created this infographic withWistia to look at how the future of learning is becoming increasingly visual and social, and how senior managers are realizing that video media is a critical information source.
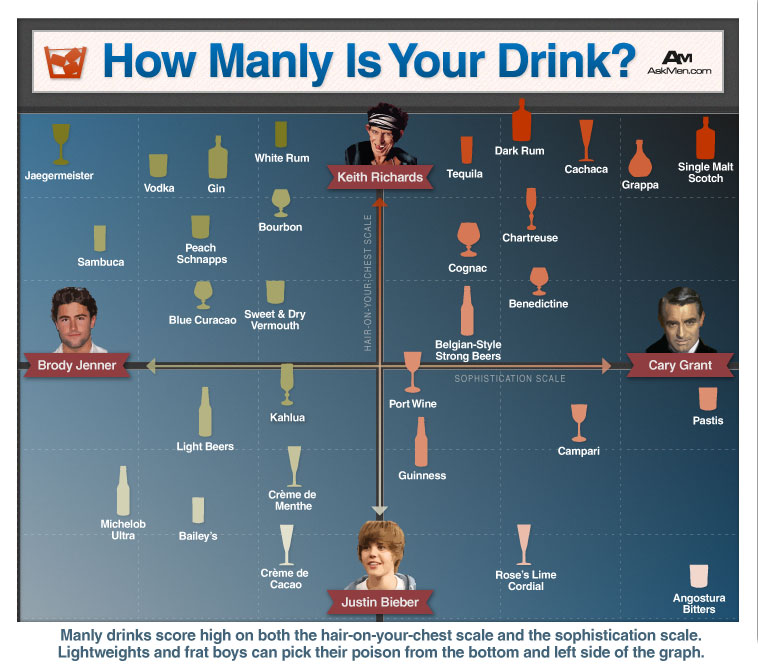
How Manly Is Your Drink?
Columnfivemedia created this humorous infographic for AskMen.com. Take a look to determine what kind of man your drink says you are.
America’s Love/Hate Relationship With Their Homeowners Association
Mention “homeowners association” to a group of homeowners and chances are you’ll get all kinds of responses: from approving nods to those not so appropriate for print. Columnfivemedia created this infographic with Credit Sesame to answer the question: Why do American homeowners have a love/hate relationship with their HOAs? Read on to find out.

Global Water Resources

Infographic by Seametrics, a manufacturer of water flow meters that measure and conserve water.
